Bua Gomutputra | September 2026 | Project 4
Are “Healthy” Breakfast Cereals Actually Healthy?
Cereal Data & Analysis
This table compares nutritional information for 32 cereals. Click a column heading to see its definition, or click a cereal name to see its calories and protein. The comparison buttons below the table highlight the cereals discussed in each section.
Nutrient amounts are listed per serving in the dataset. Serving sizes are not shown in this table, so these are comparisons of listed servings, not equal amounts of cereal.
|
Name
The cereal's name. Click a name below
to see its nutritional summary.
|
Calories
Energy per serving.
|
Protein
Grams of protein per serving.
|
Fat
Grams of fat per serving.
|
Sodium
Milligrams of sodium per serving.
|
Fiber
Grams of dietary fiber per serving.
|
Sugars
Grams of sugar per serving.
|
Rating
The dataset's score for this cereal.
Higher scores indicate a higher rating.
|
|---|---|---|---|---|---|---|---|
| 100% Bran | 70 | 4 | 1 | 130 | 10 | 6 | 68.402973 |
| 100% Natural Bran | 120 | 3 | 5 | 15 | 2 | 8 | 33.983679 |
| All-Bran | 70 | 4 | 1 | 260 | 9 | 5 | 59.425505 |
| All-Bran with Extra Fiber | 50 | 4 | 0 | 140 | 14 | 0 | 93.704912 |
| Almond Delight | 110 | 2 | 2 | 200 | 1 | 8 | 34.384843 |
| Apple Cinnamon Cheerios | 110 | 2 | 2 | 180 | 1.5 | 10 | 29.509541 |
| Apple Jacks | 110 | 2 | 0 | 125 | 1 | 14 | 33.174094 |
| Basic 4 | 130 | 3 | 2 | 210 | 2 | 8 | 37.038562 |
| Bran Chex | 90 | 2 | 1 | 200 | 4 | 6 | 49.120253 |
| Bran Flakes | 90 | 3 | 0 | 210 | 5 | 5 | 53.313813 |
| Cap'n'Crunch | 120 | 1 | 2 | 220 | 0 | 12 | 18.042851 |
| Cheerios | 110 | 6 | 2 | 290 | 2 | 1 | 50.764999 |
| Cinnamon Toast Crunch | 120 | 1 | 3 | 210 | 0 | 9 | 19.823573 |
| Clusters | 110 | 3 | 2 | 140 | 2 | 7 | 40.400208 |
| Cocoa Puffs | 110 | 1 | 1 | 180 | 0 | 13 | 22.736446 |
| Corn Chex | 110 | 2 | 0 | 280 | 0 | 3 | 41.445019 |
| Corn Flakes | 100 | 2 | 0 | 290 | 1 | 2 | 45.863324 |
| Corn Pops | 110 | 1 | 0 | 90 | 1 | 12 | 35.782791 |
| Count Chocula | 110 | 1 | 1 | 180 | 0 | 13 | 22.396513 |
| Cracklin' Oat Bran | 110 | 3 | 3 | 140 | 4 | 7 | 40.448772 |
| Cream of Wheat (Quick) | 100 | 3 | 0 | 80 | 1 | 0 | 64.533816 |
| Crispix | 110 | 2 | 0 | 220 | 1 | 3 | 46.895644 |
| Crispy Wheat & Raisins | 100 | 2 | 1 | 140 | 2 | 10 | 36.176196 |
| Double Chex | 100 | 2 | 0 | 190 | 1 | 5 | 44.330856 |
| Froot Loops | 110 | 2 | 1 | 125 | 1 | 13 | 32.207582 |
| Frosted Flakes | 110 | 1 | 0 | 200 | 1 | 11 | 31.435973 |
| Frosted Mini-Wheats | 100 | 3 | 0 | 0 | 3 | 7 | 58.345141 |
| Fruit & Fibre Dates; Walnuts; and Oats | 120 | 3 | 2 | 160 | 5 | 10 | 40.917047 |
| Nutri-Grain Almond-Raisin | 140 | 3 | 2 | 220 | 3 | 7 | 40.69232 |
| Nutri-grain Wheat | 90 | 3 | 0 | 170 | 3 | 2 | 59.642837 |
| Oatmeal Raisin Crisp | 130 | 3 | 2 | 170 | 1.5 | 10 | 30.450843 |
| Post Nat. Raisin Bran | 120 | 3 | 1 | 200 | 6 | 14 | 37.840594 |
Click the headings to see their definitions.
A Closer Look at the Data
1. Same Calories, BUT Different Nutrition
Cheerios and Apple Cinnamon Cheerios both contain
110 calories per serving, which may make them
appear nutritionally similar. However, Apple
Cinnamon Cheerios contains 10 grams of sugar,
compared with only one gram in regular Cheerios.
Regular Cheerios also provides six grams of
protein; this is three times the amount in the
flavored version.
Their ratings also differ: Cheerios scored 50.8,
while Apple Cinnamon Cheerios scored 29.5.
Regular Cheerios does contain more sodium:
290 milligrams compared with 180 milligrams.
This comparison demonstrates that two products
with the same calorie count can have very
different nutritional profiles.

2. Does a Healthy Name Tell the Whole Story?
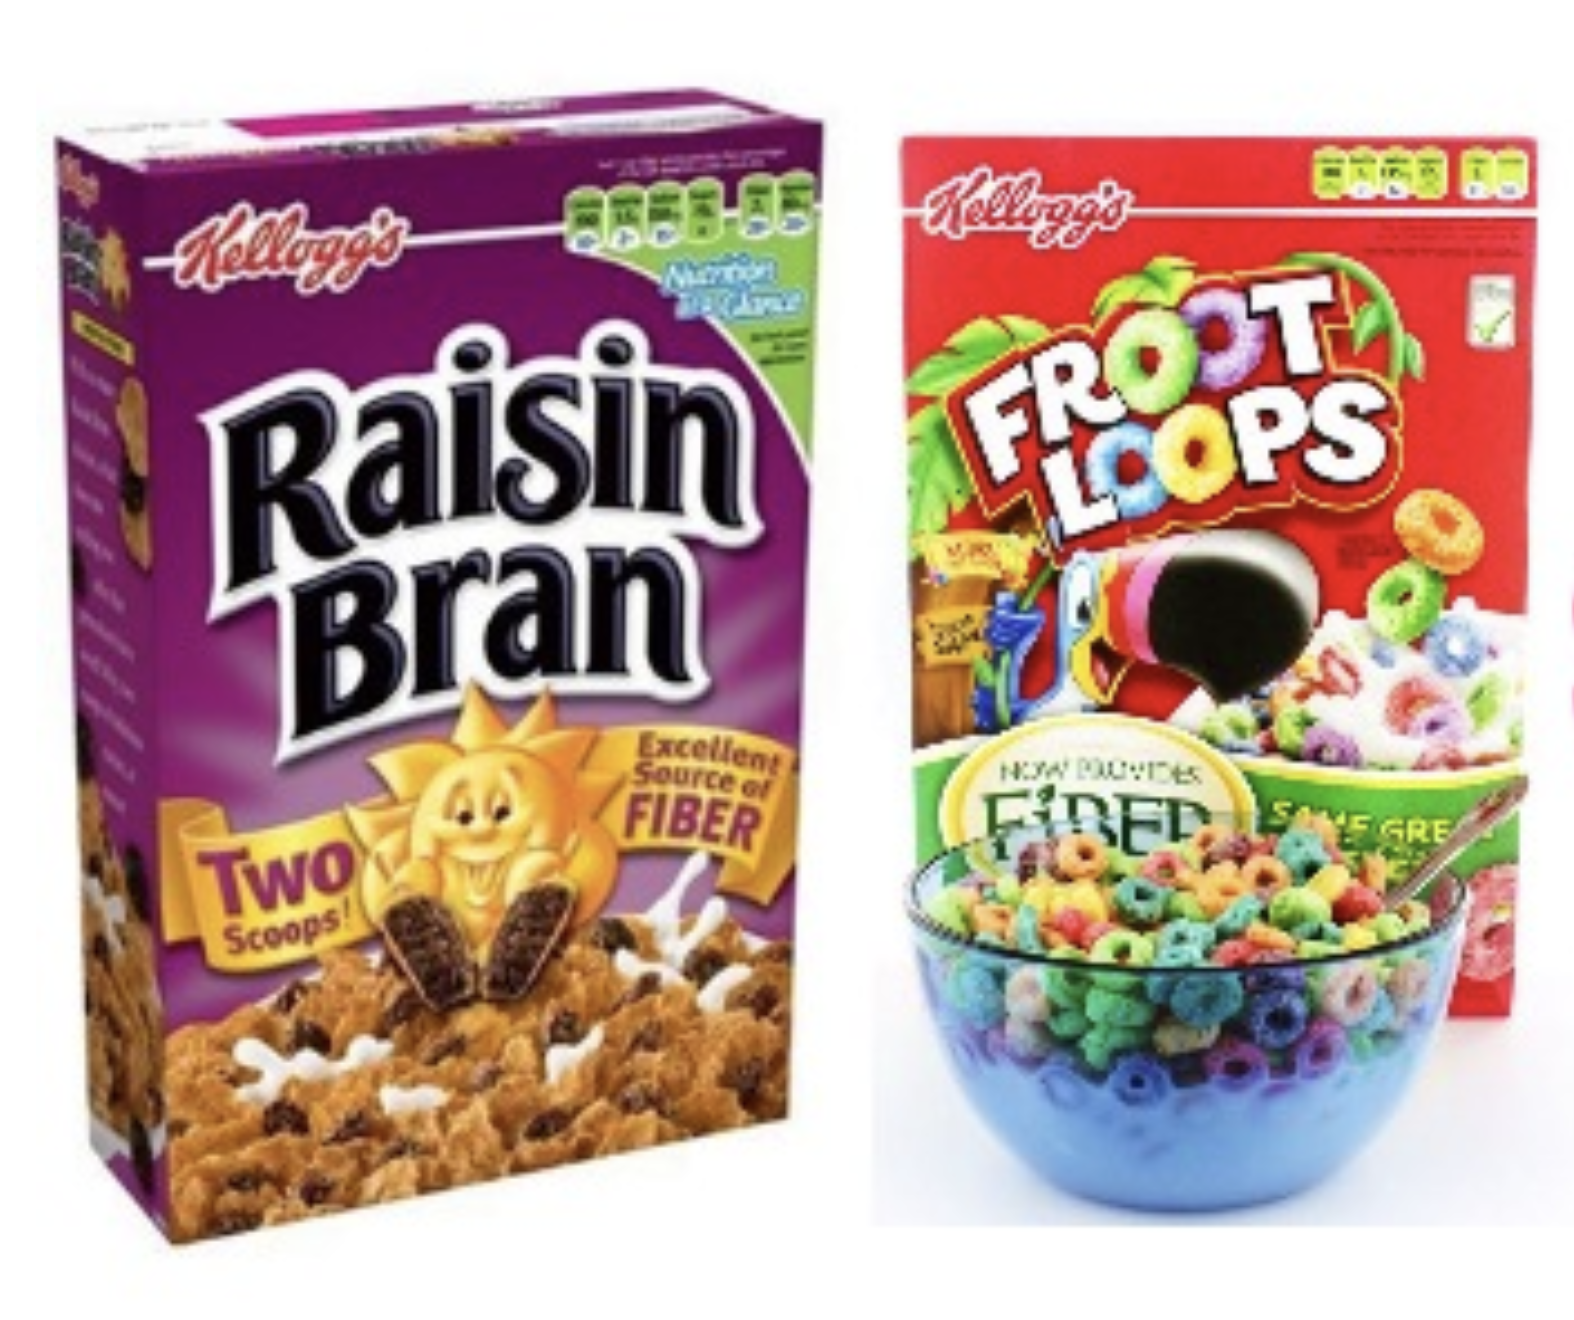
Post Nat. Raisin Bran may appear healthier than
Froot Loops because its name emphasizes fruit
and bran. However, in this table it contains
14 grams of sugar per serving, one gram more
than Froot Loops. It also has 200 milligrams of
sodium compared with 125 milligrams in Froot Loops.
Still, Post Nat. Raisin Bran provides six grams
of fiber and three grams of protein, compared
with one gram of fiber and two grams of protein
in Froot Loops.
These differences show why a cereal's name
does not provide enough information on its own.
The values are per listed serving; serving sizes
should also be checked before comparing equal
amounts of these cereals.
3. Highest and Lowest Ratings in This Table
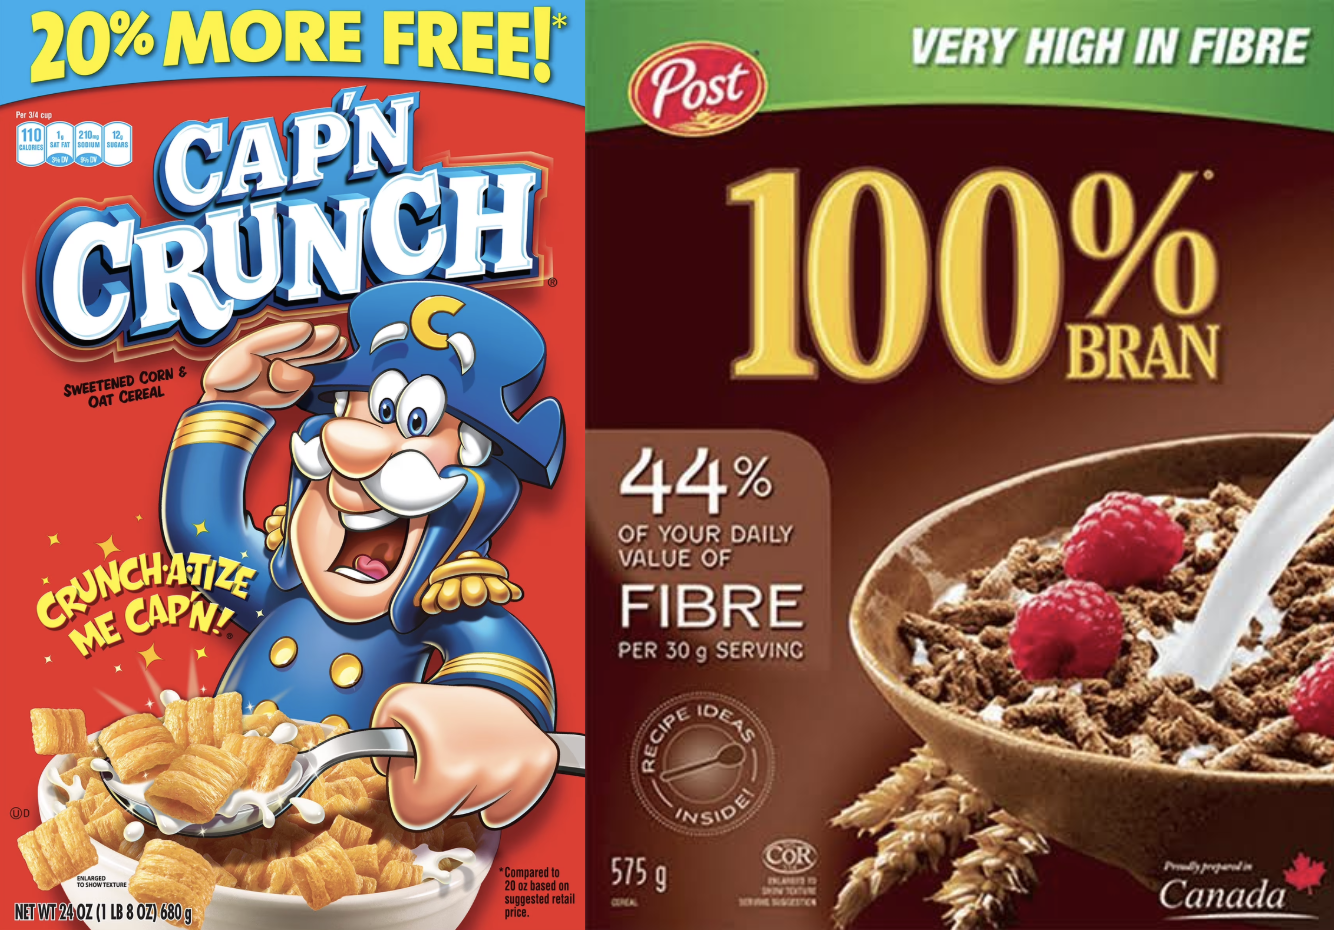
All-Bran with Extra Fiber received the highest
rating in this table at 93.7. It contains
14 grams of fiber, four grams of protein and
no sugar. In comparison, Cap'n'Crunch received
the lowest rating at 18.0, with 12 grams of
sugar, no fiber and only one gram of protein.
All-Bran with Extra Fiber also contains
50 calories per serving, compared with
120 calories in Cap'n'Crunch.
For this pair, the higher-rated cereal has
more fiber and protein and less sugar.
This comparison alone does not establish how
the rating is calculated. The individual nutrient
values show more clearly how the cereals differ.
These examples show why it helps to compare several nutrients rather than relying on calories or a cereal's name alone. Visit the resources and glossary for sources and explanations of key terms.